Results
As a result of differences in local soil and weather conditions simulated average rain fed maize yields in 1999 – 2010 vary from less than 1 to more than 4 ton grain dry matter per ha with a fertilizer application of 100 kg N ha-1.
Figure 1 shows lowest yields near desert areas, e.g. in the Sahelian zone, and in most other cropland areas, yields are between 2.5 and 3.5 ton grain dry matter per hectare. Currently irrigated areas where maize cannot be grown without irrigation, such as the Nile delta, have not been considered in calculating rain fed yields.

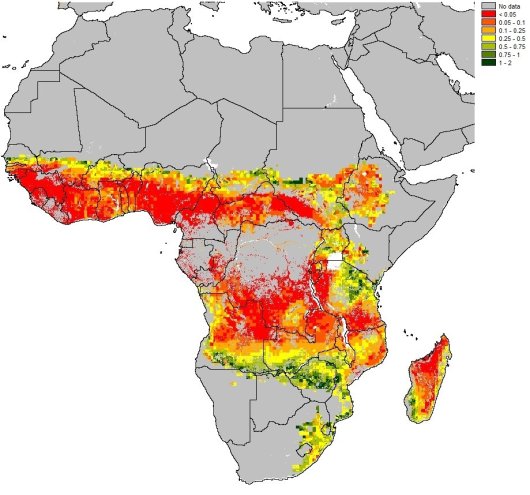
Figure 2 illustrates the large spatial variation in the ratio fertilized (100 kg N ha-1) and actual (viz. ~2000) maize yields, mostly ranging from 1-2 times to more than 5 times. Ratios in Figure 2 are relatively low in countries that already apply fertilizer (e.g. South Africa) and relatively high in countries without (much) fertilizer use (e.g. Côte d'Ivoire). Average yield gap closure, calculated as the ratio of the yield at 100 kg N ha-1 (Fig. 1) and the rain fed potential yield (results not shown), ranges from 0.3 to 0.6 in most cropland areas of Africa with an average of 0.4. This indicates that considerably higher yields are possible in large parts of Africa with higher fertilizer application levels exceeding 100 kg N ha-1.

Differences in simulated maize yields under irrigated and rain fed conditions, both fertilized with 100 kg N ha-1, are shown in Figure 3 (average of 1991 – 2010). The simulated irrigated yields refer to the production of maize with the same cropping period as under the rain fed conditions but without drought stress. Differences appear moderate throughout a large part of Africa (< 0.5 ton grain maize ha-1, except in dryland areas). The required amount of irrigation water ranged from 0 to more than 200 mm (results not shown). The limited extra yield obtained by irrigation is partly caused by the limited fertilization of 100 kg N ha-1. At higher fertilization levels the yield differences between irrigated and rain fed conditions will become larger.

The shown average results are based on calculations per year which enables to analyze the effect of temporal weather variability on grain yields. When economic parameters, such as fertilizer and crop prices, are included financial revenues and economic risks of growing maize with higher fertilizer inputs can be assessed and compared with the current situation. Poor farmers tend to avoid (high) risks and will therefore hesitate to increase (costly) inputs, resulting in low yields and higher risks of land degradation. The effect of risk reducing measures can be spatially explored in combination with historic and expected future climate conditions which may contribute to sustainable intensification of crop production.
References
- Conijn, J.G., Querner, E.P., Rau, M.L., Hengsdijk, H., Kuhlman, J.W., Meijerink, G.W., Rutgers, B., Bindraban, P.S., 2011. Agricultural resource scarcity and distribution: a case study of crop production in Africa. Wageningen: Plant Research International, Report / Plant Research International 380.
- Conijn, S., Wolf, J., Hengsdijk, H., Descheemaeker, K., Bindraban, P., 2013. A generic methodology for calculating water and nutrient requirements for attaining target crop yields. Noordwijkerhout: Wageningen University, First International Conference on Global Food Security, 2013-09-29/ 2013-10-02.
- Jing, Q., Conijn, J.G., Jongschaap, R.E.E., Bindraban, P.S., 2012. Modeling the productivity of energy crops in different agro-ecological environments. Biomass and Bioenergy 46: 618 - 633.
- Monfreda, C., Ramankutty, N., Foley, J.A., 2008. Farming the planet: 2. Geographic distribution of crop areas, yields, physiological types, and net primary production in the year 2000. Global Biogeochemical Cycles 22, GB1022, doi:10.1029/2007GB002947.
- Ramankutty, N., Evan, E.T., Monfreda, C., Foley, J.A., 2008. Farming the planet: 1. Geographic distribution of global agricultural lands in the year 2000. Global Biochemical Cycles 22. DOI: 10.1029/2007GB002952.
- Setiyono, T.D., Walters, D.T., Cassman, K.G., Witt, C., Dobermann, A., 2010. Estimating maize nutrient uptake requirements. Field Crops Research 118: 158–168.
